 The impressive fiscal 2016 third-quarter results that topped the analysts’ estimates enabled the banking and finance institution Citigroup Inc (NYSE: C) to rally by $10, or about 20%, to hit a high of $56.72 in the last week. The current price is still 13% lower than the target price of $63 given by the analysts, after Citi reported its quarterly results.
However, the recent information related to the company indicates that the stock would undergo a short-term correction. Citigroup is expected to report its fourth-quarter results on January 18. The analysts anticipate earnings of $3.11 billion or $1.09 per share for the current quarter.
The estimated EPS is $0.03 per share or 2.83% higher than $1.06 per share reported in the similar quarter of fiscal 2015. Based on the current share price, the PE ratio would reach a high of 12.83, if Citigroup meets the earnings estimates of analysts.
Citi
Furthermore, the EPS would still be 12.80% lower than the second-quarter EPS of $1.25 per share.
Following the report of second-quarter results, as many as 93 funds have sold all the Citigroup shares owned by them. Furthermore, nearly 449 funds have decreased their positions. The institutional bearish sentiment increased to 0.83 at the end of the second quarter 2016, from 0.74 in the prior quarter.
Several established funds have downgraded Citi in the past few weeks. On Wednesday last week, the Jefferies Group has downgraded the stock from ‘buy’ to ‘hold’ rating. In the second week of November, the analysts at Vetr research firm have lowered the rating to ‘sell’, from the prior ‘buy’ rating.
Finally, the volatility is expected to increase in the next few weeks as markets would be closely watching the transfer of power from Obama to Trump. The investors would book at least partial profits in the banking and infrastructure stocks, considering the fact that the rally so far was based on expectations rather than reality. Thus, it would be wise to remain short in the banking stocks such as the Citigroup for the next few weeks.
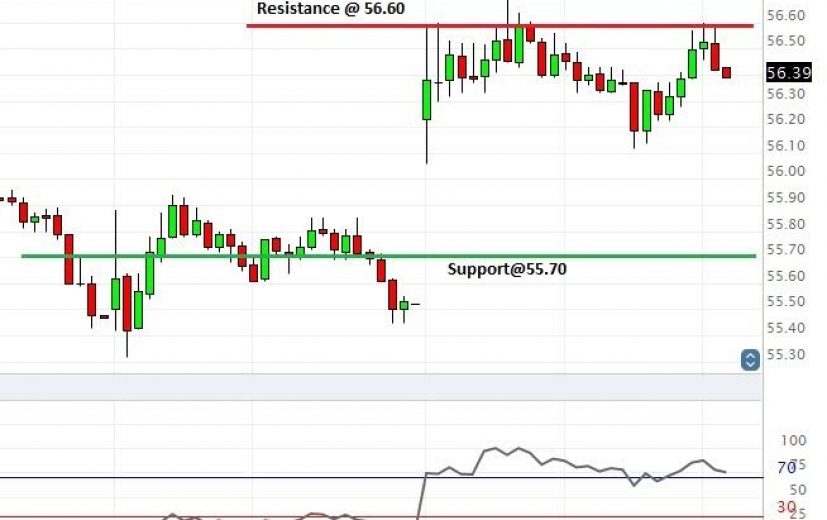
After failing to cross above the level of 56.50, the stock has started retreating. The stochastic RSI indicator, with a reading above 70, reflects an overbought situation. It should be noted that we are using a 5-day price chart to analyse and forecast short-term price movements for the benefit of binary traders.
So, from the perspective of a binary trader, it can be stated that there is a good opportunity to benefit from the short-term downtrend by investing in a put option (low or below option in the case of certain binary brokers). The trader should enter only if the traded price is near 56.50. The trader should choose a validity of one week for the contract.


